Mastering Go Profiling

In the world of software development, ensuring your application runs efficiently is paramount. Go, with its efficient concurrency model and performance-focused design, is a great language for building high-performance applications. At DAS, Go is at the heart of our technology stack, providing the foundation for building high-performance, scalable applications. However, even the best code can benefit from optimisation. Profiling and performance testing are essential tools in a developer's toolkit to identify bottlenecks and optimise Go applications. To ensure our applications run optimally, we must continuously profile and test their performance. In this post, we’ll explore the basics of Go profiling and performance testing while delving into some of the techniques and tools we use at DAS.
What is Profiling and Why it Matters?
Profiling is the process of analysing a program to understand its performance characteristics and resource usage. It involves measuring various aspects of the program’s execution, such as CPU time, memory usage, and I/O operations, to identify performance bottlenecks and inefficient code paths. The goal of profiling is to provide insights that can help developers optimise their code, improve performance, and make informed decisions about where to focus optimisation efforts.
Key aspects
-
Complexity and Scale: DAS programs are inherently complex, handling massive datasets and performing intricate calculations in the background. This complexity necessitates a thorough understanding of how our applications utilise resources and where potential inefficiencies may lie.
-
Performance and Efficiency: Our customers rely on DAS to provide timely and accurate answers to their queries. Performance bottlenecks can significantly impact the responsiveness of our applications, leading to delays and potentially erroneous results. Profiling helps us ensure that our applications run as efficiently as possible, delivering fast and reliable performance.
-
Necessity for Measurement: To improve anything, we first need to measure it. Profiling provides the necessary metrics to quantify the performance of our applications. These metrics allow us to pinpoint specific areas for optimisation, ensuring that our efforts yield meaningful improvements.
-
Ensuring Scalability: As DAS continues to grow, our applications must scale seamlessly to handle increasing loads. Profiling helps us identify and address bottlenecks early, ensuring that our systems can scale efficiently and continue to perform well under heavy usage.
-
Cost Management: Efficient resource utilisation is critical for cost management, especially when dealing with large-scale data processing. Profiling helps us minimise resource usage without sacrificing performance, ensuring cost-effective operations.
-
Maintaining High Availability: High availability is a core requirement for DAS. Performance issues can lead to downtime or degraded service quality. Profiling allows us to proactively identify and fix performance problems, contributing to the reliability and availability of our services.
Getting Started with Profiling in Go
Go provides several types of profiling, each focusing on different aspects of performance.
Types of Profiling in Go
- CPU Profiling: Measures the amount of CPU time each function takes.
- Memory Profiling: Analyses memory allocation patterns and identifies potential memory leaks.
- Goroutine Profiling: Monitors the behaviour and lifecycle of goroutines.
- Block Profiling: Identifies points where goroutines are blocked and waiting.
Profiling Tools in Go
Go’s standard library includes powerful tools for profiling. These tools help us understand how our programs use resources and where they spend most of their time.
- runtime/pprof: Provides programmatic access to profiling data.
- net/http/pprof: Enables profiling over HTTP, useful for web applications.
go tool pprof: Analyses and visualises profiling data.
We're going to dive deep into various profiling techniques and explore real-life examples using the powerful pprof package in the upcoming sections.
CPU Profiling
CPU profiling measures how much time your program spends executing various functions.
Integrate
Here's how to perform CPU profiling in Go by integrating the runtime/pprof package in your main module,
package main

import (
   "runtime/pprof"
   "os"
   "log"
)

func main() {
   f, err := os.Create("cpu.prof")
   if err != nil {
      log.Fatal("could not create CPU profile: ", err)
   }
   defer f.Close()
   if err := pprof.StartCPUProfile(f); err != nil {
      log.Fatal("could not start CPU profile: ", err)
   }
   defer pprof.StopCPUProfile()

   // Your application code here
   // ...
}
Run your application as usual. The profiling data will be saved in cpu.prof.
Analyse
Use the go tool pprof command to analyse the profile. In the interactive pprof shell, we can use commands like top, list, and web to visualise and analyse the profiling data.
Let's analyse the CPU profile for one of our services to see if there is an opportunity for optimisation.
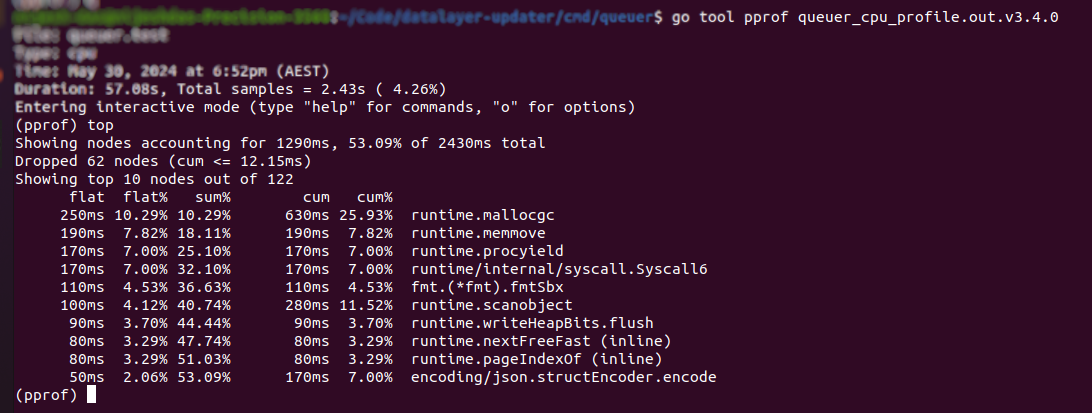
The top command shows by default the top 10 functions which consumed most of the time. However, we can append number in the format of topn to limit the list, eg. top3. There are two main columns, flat and cum. A flat is the flat time taken by a function itself. The top command lists functions in descending order of the flat time. On the other end, cum represents the time taken directly by a function as well as all the functions down the stack, it represents the cumulative time taken.
It's evident from the profile above that a few runtime functions take most of the CPU time. Further, sorting this list by cumulative time top -cum indicates that scanning an object from the DB result took most of the time as shown below.
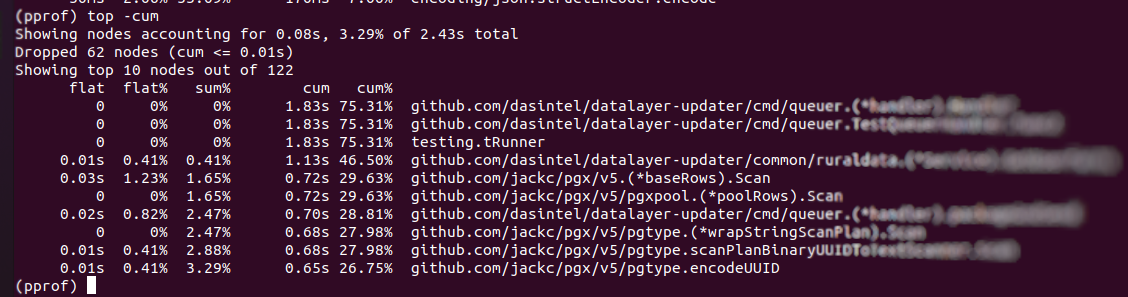
The cumulative time taken by our internal DB function and relevant external dependency for scanning an object took a larger chunk of time. It was responsible for preparing a slice from ~300K results using the append() method. It caused runtime memory movement for copying slices (runtime.memmove) while growing its capacity and then wiping it with garbage collection (runtime.mallocgc) for these large result sets. We further compared these stats with memory profiling which we will be discussing in the next section.
We then changed the approach of preparing result sets by determining the size of results and using a fixed size array which reduced runtime memory move and cumulative CPU time.
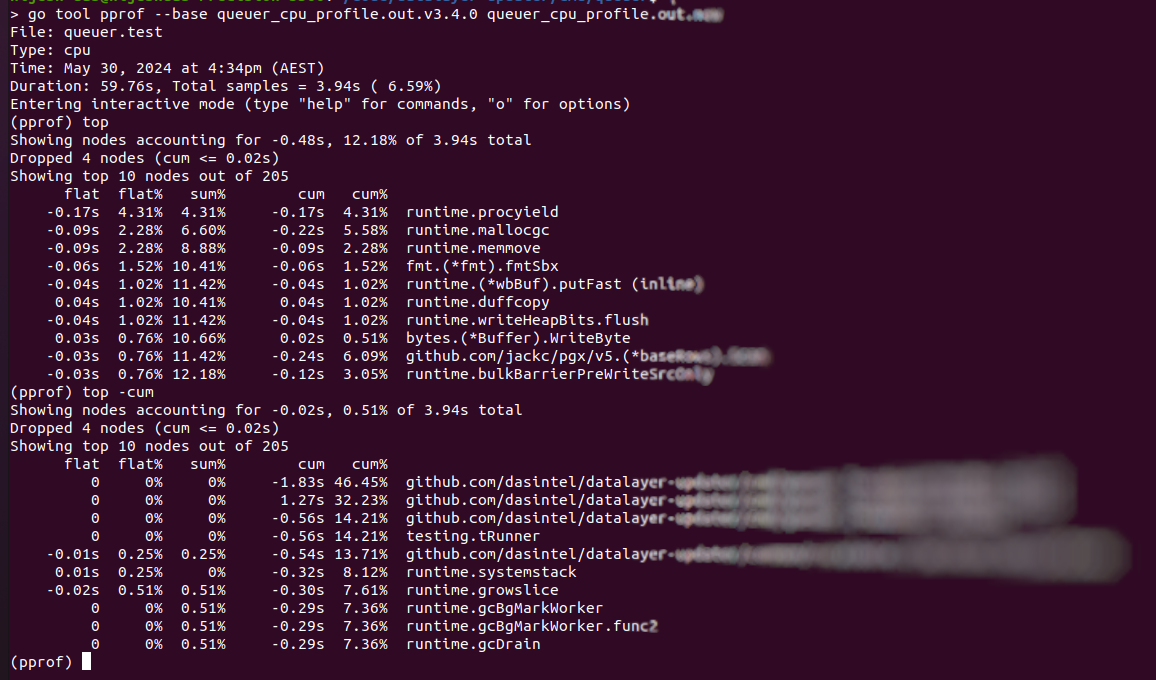
The good thing is the profiler allows us to visualise the difference between two sets. As shown above, CPU time is reduced relative to the last profile output.
Memory Profiling
Go manages memory using both a stack and a heap. Local variables in Go are stored in a stack, where memory allocation and deallocation are fast and automatically managed by the language. In contrast, dynamically allocated memory, such as pointers, slices, and maps, is stored in the heap. Efficient management of heap memory is crucial for application performance, which leads to the need for garbage collection. With pprof, we can generate a heap memory profile which helps identify memory leaks and inefficient memory usage.
Integrate
To conduct memory profiling, we can utilise the pprof.WriteHeapProfile function.
f, err := os.Create("mem.prof")
if err != nil {
   log.Fatal("could not create memory profile: ", err)
}
defer f.Close()
runtime.GC() // get up-to-date statistics
if err := pprof.WriteHeapProfile(f); err != nil {
   log.Fatal("could not write memory profile: ", err)
}
Analyse
Now that we are familiar with various terms and commands for pprof, it will be easier for us to analyse the memory profile further using specific flags. Let's continue exploring the DAS microservice we discussed in the last section and see how we identified higher memory usage, which caused longer runtime in the function responsible for preparing results from the database.
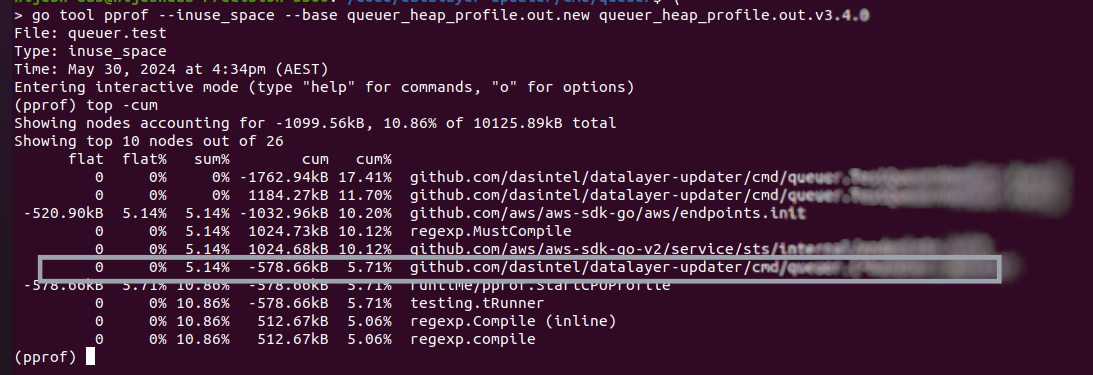
It's evident from the profile above that the updated code in the highlighted function consumed 578KB less in-use memory than the last release. It also shows that the cumulative total in-use memory was reduced by 17.41% when initiating the profiler.
Furthermore, the memory profile allows differentiation between in-use memory and allocated memory. The --inuse memory mode focuses on memory that is currently in use by the application at the time the profile is taken. It shows how much memory is actively being used by live objects. The --alloc mode tracks the total amount of memory allocated over the lifetime of the application, regardless of whether it is still in use or has been freed.
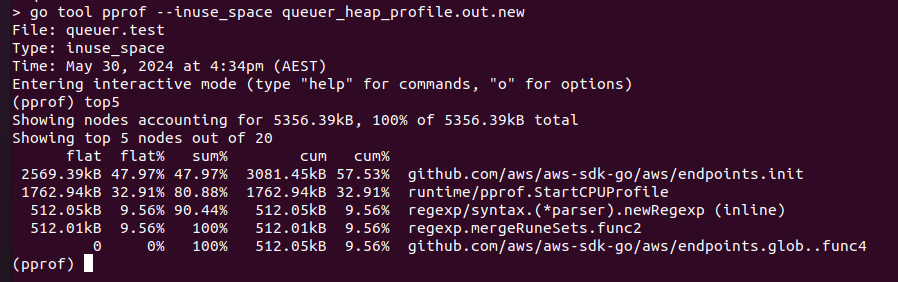
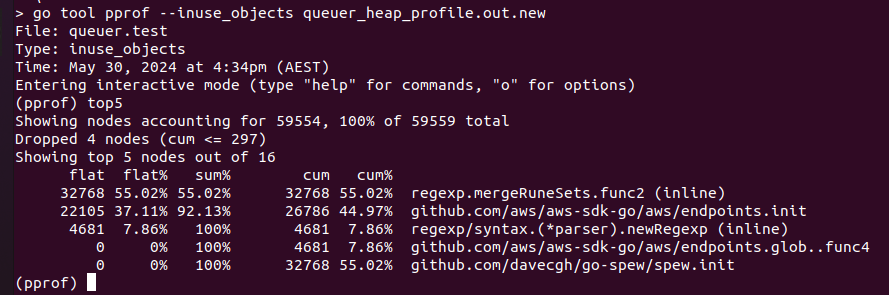
These modes are used to determine the total memory in use by live objects (--inuse_space) and the number of objects that are currently in use (--inuse_objects) as shown above.
Similarly, the modes --alloc_space and --alloc_objects are used to compare the total allocated memory during the program's execution to the memory in use.
Goroutine and Block Profiling
goroutines
Goroutine profiling monitors the behaviour and lifecycle of goroutines, which are lightweight threads managed by the Go runtime. This type of profiling is crucial for understanding how goroutines are created, scheduled, and terminated, and for identifying issues such as goroutine leaks or excessive goroutine creation.
gf, err := os.Create("goroutine.prof")
if err != nil {
   log.Fatal("could not create goroutine profile: ", err)
}
defer gf.Close()
if err := pprof.Lookup("goroutine").WriteTo(gf, 0); err != nil {
   log.Fatal("could not write goroutine profile: ", err)
}
Blocked Goroutines
Block profiling identifies points where goroutines are blocked and waiting, which can indicate contention or synchronisation issues. This is useful for diagnosing performance problems related to locks, channels, and other synchronisation primitives.
runtime.SetBlockProfileRate(1) // Capture every blocking event

// Your application code here

f, err := os.Create("block.prof")
if err != nil {
   log.Fatal("could not create block profile: ", err)
}
defer f.Close()
if err := pprof.Lookup("block").WriteTo(f, 0); err != nil {
   log.Fatal("could not write block profile: ", err)
}
Goroutine and block profiling are essential tools for understanding and optimising the concurrency performance of Go applications. By leveraging these profiling techniques, we can identify and address issues related to excessive goroutine creation, goroutine leaks, and blocking operations, ensuring that your applications run efficiently and handle concurrent workloads effectively. At DAS, incorporating these profiling practices into our development and monitoring processes helps maintain high performance and reliability in our services and other high-concurrency applications.
Conclusion
Profiling in Go is not just about finding and fixing performance issues; it's about understanding how our application behaves under various conditions. For an organisation like DAS, where performance and efficiency are paramount, regular and thorough profiling ensures that our applications can handle the demands of processing large amounts of data efficiently. By leveraging the capabilities of pprof, developers can make informed decisions to optimise their code, leading to faster, more reliable, and more scalable applications. With its various output formats pprof allow us to analyse the Go application's performance from different angles. Each format serves a specific purpose, whether it's visualising the call graph, inspecting detailed source code listings, or quickly identifying top resource consumers.
Incorporating these profiling techniques into development and maintenance practices helps us maintain high-performance standards, deliver better user experiences, and meet the evolving needs of our customers.